In the world of data, separating meaningful signals from noise is much like distinguishing melodies in a symphony. Every note matters, but only when arranged thoughtfully does it become music. In analytics, Fisher’s Linear Discriminant Analysis (LDA) performs a similar role—it identifies the perfect balance between multiple variables to highlight what truly separates one class from another.
Seeing Data as a Landscape
Imagine standing on a hill overlooking a valley divided by streams and ridges. Each cluster of trees or fields below represents a different data class—say, customers likely to purchase versus those who won’t. The challenge is to draw a line or plane that best divides these regions without losing too much information.
That’s where LDA steps in. It’s not about creating arbitrary divisions; it’s about finding that one optimal direction in which the differences between groups are most pronounced while keeping overlap minimal.
Students pursuing a data science course often encounter LDA early in their learning journey. It teaches the importance of dimensionality reduction—not just reducing data for convenience, but to preserve the story data is telling in the most efficient way possible.
The Philosophy Behind LDA
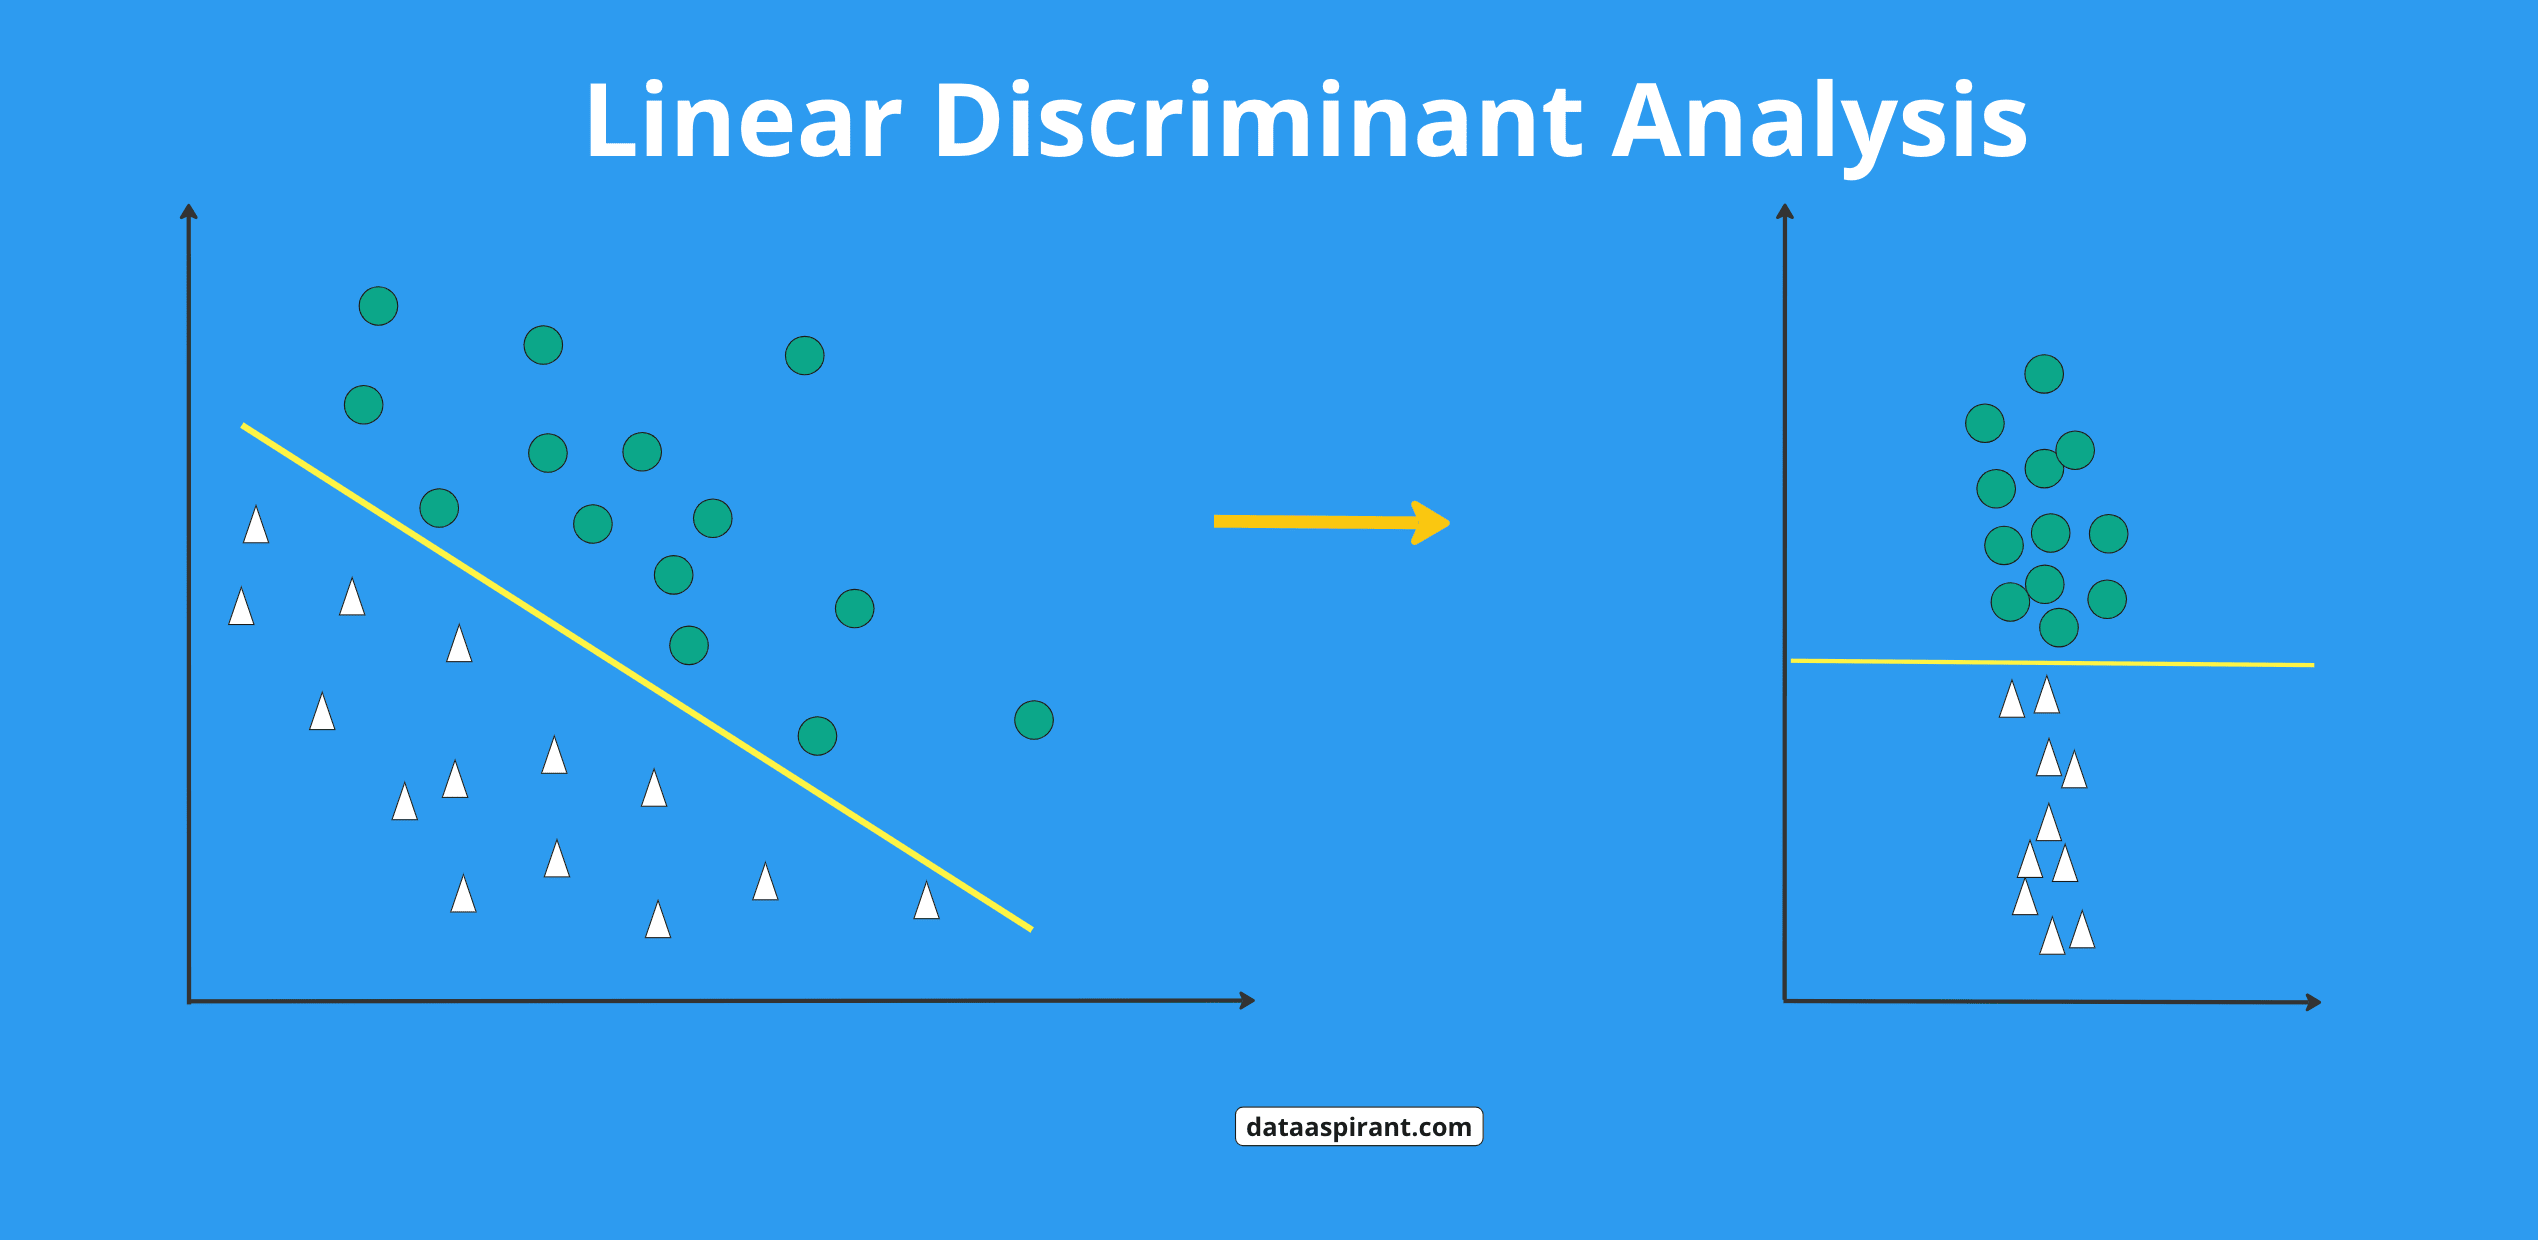
At its heart, Fisher’s LDA seeks to maximise the separation between classes while minimising the variation within each class. It’s a balancing act, like tuning an instrument—too sharp, and the sound becomes unpleasant; too flat, and the melody loses clarity.
Mathematically, this balance is achieved by finding a linear combination of features that produces the best possible projection of data onto a lower-dimensional space. Each data point is projected onto this line so that similar points cluster together, and different classes appear far apart.
This principle is crucial in tasks such as face recognition, sentiment analysis, and medical diagnosis—where understanding subtle differences leads to more accurate classification.
Why LDA Matters in Modern Analytics
In today’s world of high-dimensional data, where variables often outnumber samples, clarity becomes elusive. LDA offers a way to simplify without oversimplifying. It compresses data into its most informative form, enhancing model performance and interpretability.
For instance, in image recognition, instead of analysing thousands of pixel values, LDA can reduce the dataset to just a few essential dimensions—speeding up computation while maintaining accuracy. Similarly, in marketing analytics, it helps identify which customer attributes contribute most to purchasing behaviour.
Learners exploring this concept through a data science course in Mumbai gain practical exposure to applying LDA in Python or R, seeing firsthand how it transforms raw data into meaningful insights that power business and research decisions.
The Practical Workflow
The beauty of LDA lies in its simplicity of workflow. Analysts start by grouping data points based on known categories—say, spam versus non-spam emails. LDA then computes mean vectors for each class, measures how far apart these means are (between-class variance), and how scattered the data points are within each class (within-class variance).
The goal? To maximise the ratio of between-class variance to within-class variance—essentially making groups as distinct as possible. Once calculated, LDA projects all points onto a single line or plane, clearly showing separations that were previously hidden in complex data spaces.
Beyond Classification: Interpretation and Insights
Unlike many modern black-box algorithms, LDA provides interpretability. Each weight in its linear equation represents how strongly a feature contributes to distinguishing between classes. This transparency is invaluable when decisions carry real-world consequences—like identifying at-risk patients or approving loans.
Moreover, LDA forms the foundation for more advanced techniques such as Quadratic Discriminant Analysis (QDA) and serves as a bridge between statistical theory and machine learning.
Professionals who study this concept as part of a data science course in Mumbai learn that mastering tools like LDA isn’t just about coding—it’s about critical thinking, ethics, and understanding data at its core.
Conclusion
Fisher’s Linear Discriminant Analysis remains one of the most elegant approaches in data science—simple, interpretable, and effective. It’s like finding the right lens for a blurred image, bringing clarity without losing detail.
As industries increasingly depend on data-driven decisions, understanding techniques like LDA allows analysts to extract meaningful insights even from overwhelming complexity.
For anyone eager to master these foundations, enrolling in a data science course offers the perfect starting point. It’s not merely about learning algorithms—it’s about learning how to see patterns where others see noise, a skill that defines every successful data scientist.
Business name: ExcelR- Data Science, Data Analytics, Business Analytics Course Training Mumbai
Address: 304, 3rd Floor, Pratibha Building. Three Petrol pump, Lal Bahadur Shastri Rd, opposite Manas Tower, Pakhdi, Thane West, Thane, Maharashtra 400602
Phone: 09108238354
Email: enquiry@excelr.com